
GUEST BLOG: OP ED. VIEWS EXPRESSED ARE THE PERSONAL VIEWS OF THE AUTHOR, GABRIEL SILVERSTEIN, SIOR, AND DO NOT REPRESENT THE VIEWS OF SIOR, ITS EMPLOYEES, OR CLIENTS.
I am pretty sure Mark Twain would be fine with my twist on his famous saying in titling this post, especially as it serves as my intro to actions and stances of our government and quasi-government, where Twain also said “there is no good government at all and none possible”.
For the past year and a half the Fed has felt like it was no longer a data-driven guardian of the economic health of the nation, and a lot more like a group with an agenda searching for data to justify it. When headline inflation wanes, it’s the core inflation they’re concerned about (because real people don’t feel the impact of those pesky volatile things, like gas and food prices?). When that eases up, a strong jobs report can justify another rate hike. All this despite the fact that the Fed has little to no ability to affect inflation stemming from supply-chain disruption, only time and money (investment) can fix that, and clearly the market has done a lot of that over the last year.
Inflation and job market data are two of the big movers in the interest rate/policy game. The Bureau of Labor Statistics (the BLS) publishes these and other key economic data. However, while the markets move mostly on the big announcements monthly for each of these, jobs data, for one, gets far less headlines later when they revise it, not once, but twice (or more), frequently changing the tone the original data pretty meaningfully. Most of this year those revisions have been downward. August and September revisions alone so far combined for a further lowering of the numbers by 101,000 jobs1. Earlier, the BLS also revised the numbers for the entire prior 12 months – down by 306,000 vs. prior reports. That’s pretty major when the “wrong” numbers are the ones guiding policy and the market!
The other jobs data problem as a policy-setting tool is the “seasonal adjustment” element that can skew numbers in ways that are nearly impossible to make sense of (GDP numbers are also “seasonally adjusted”). The January’s job report (released in February) was one of the biggest “wow” reports we’ve seen in years, over 500,000 new jobs. In fact, the economy lost over 2.4 million jobs that month2. Confusing? That’s the actual BLS data, but since the BLS thought we’d lose nearly three million jobs, they “seasonally adjusted” it upward by that amount, which meant on paper we “gained” over half a million jobs. Try doing that math in your quarterly management report - I hear Mark Twain laughing hysterically!
That commentary link has one of the better commentaries I have seen about the seasonal jobs adjustment: “…when I managed the main floor of a Sacramento J.C. Penney store, I tried to reassure laid‐off Christmas employees in January that, technically speaking, they were all still employed—on a seasonally adjusted basis.”
Many of the jobs added this year have been lower paying hospitality and service jobs that either job seekers aren’t interested in, or are step downs from where they were previously employed. Getting a new job may take them off the unemployment roll, but making less money is clearly a negative impact to one’s economic health. That isn’t addressed in the headline data, though.
People could be surprised if inflation increases in December or January, after this morning’s (on 11/14) release that inflation was flat in October, as gas prices continue to fall since then and I see earlier-than-ever holiday sale discounting. That’s because last November and December the index number actually fell. This year that already happened last month, in October (the “flat” report was “seasonally adjusted”, the index actually went down slightly). But if overall prices stay level vs. October numbers, the 12 month year-over-year number will go up, even as an annualized monthly number is weak, so the only way for inflation not to rise over the next two months is to actually have continued deflation, perfectly logical, right? YOY inflation would be nearly 3.7% again by the end of December if prices merely stay flat the next two months3. It’s a comparison year math problem, not a current inflation problem, but try to explain that to the Fed. Anything less than that shows continued deflationary trends that are probably more dangerous to the economy than inflation.
Ironically the Fed’s own rate increases are now themselves a major contributor to the inflation they cite as their rate hike justifications. Housing costs are by far the heaviest-weighted portion of the inflation measurement and one of the biggest increases offsetting falling prices in other categories right now. The Fed directly increases those in the form of the “equivalent rent” home ownership cost (think higher rates mean higher mortgage payments, kind of a way to measure ownership costs alongside rental costs), which is in fact the heaviest category weighting in the CPI, and three times the weighting of rental residence costs, the second heaviest weighted category4,5. Indirectly the pause in construction of new rental projects because of higher rates also keeps supply down, and therefore pricing up on the rental side as well.
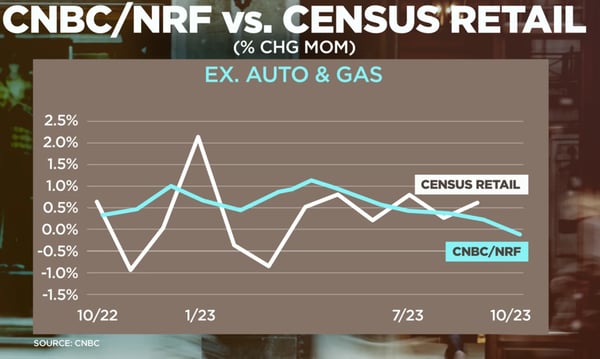
Trying to improve one statistic’s bad data problem, CNBC, NRF and Affinity Solutions came out with a near real-time consumer spending measure, anonymizing credit and debit card transactions daily. That’s a big improvement over the government retail spending numbers – again the numbers largely used for policy making – which can be as many as three to six months delayed in being fully captured and reported, not to mention issues like how e-commerce sales don’t fit the 1992 base year the government uses, so they compare those to base year catalog sales…very helpful as a policy-setting measure! Oh, and real people spending items like gasoline aren’t in the government measure. Note the volatility in the government’s measure here (see chart) compared to the CNBC/NRF index’s more precise and less schizophrenic (i.e. logical) line.
The Fed’s policy of the past 15 years – primarily targeting a ~2% inflation rate – has arguably gutted the retirement of the middle class just as the largest retirement wave in our history (the Baby Boomers) unfolds. That can be a long article itself, but in brief, as pensions and 401(k)s suffered from very low bond rates for 15 years, their meager growth has significantly held back the buildup of that retirement savings vs. what would have been with a still-stable but modest growth rate in prices and values. Oddly the Fed today seems to be lamenting a 3.5% inflation/growth rate and modest job market strength as bad (did you notice the unemployment rate is up to nearly 4% already).
Moody’s just downgraded the US Government’s debt rating outlook to “negative”, citing high interest rates as one of the key reasons. It continues to feel like the Fed is the only group left that agrees with itself on its strategy. The market for over a year has been weak despite all the “economic strength” the Fed sees to justify its continued rate increases. That’s why even hints of data that is weak, ironically spurs market rallies these days – because the market thinks that may finally end the unjustified brutality the Fed keeps doling out on everyone. We’ll see if that finally comes true. The Fed has been pretty crafty at continuing to find that one outlier statistic they need to justify their policy, even when the market disagrees with them, and to Mark Twain’s famous quote, if you want to make data support your actions instead of guiding them, statistics are a great way to do it.
Numbered References and Notes
1 See the last paragraph in the BLS report link for that August/September revision note.
2 Initial report numbers were over 2.5 million jobs lost as shown in the report link analyzing the seasonal adjustment, later revisions slightly changed that to a number closer to 2.4 million jobs.
3 If Dec-23 had the same 307.671 index value as Oct-23 did, compared to Dec-22’s index value of 296.797, the resulting YOY CPI would be 3.66%: (307.671-296.797)/296.797
4 I have made the BLS category spreadsheet much easier to view here.
5 For more on the BLS CPI category weighting methodology use this link.
6 For further reference and a step-by-step detail on how inflation is measured read this link.